• News
  • Events
  • Folios
  • Awards
  • Shop
  • Menu
    • Home
    • News
    • Events
    • Folios
    • Awards
    • Shop
      • All Products
      • Consultations
      • Directories
      • Folio
      • Publications
      • Recordings
    • About
        • About the AOI
        • Our History
        • Our People
          • Staff
          • Meet Up Hosts
          • Board
          • Patrons
        • Contact Us
        • Jobs
        • FAQs
    • Campaigning
      • Campaigns
        • Pay The Creator
        • Diversity & Inclusion
        • Not a Hobby
        • The AOI’s Stance on AI
        • Fair Terms for Creators
        • Price it Right
        • Keep Your Copyright
      • Legislation
      • Partner Organisations
      • Fighting Fund
    • Resources
      • All Categories
        • Pricing
        • Finance
        • Self Promotion
        • Business Practice
        • Copyright
        • Contracts
        • Animation
      • Inside Illustration
      • Illustration Pricing Survey
      • Consultations
      • Helpdesk
      • Discounts
      • AOI Meet Ups
      • Recordings
    • Member Dashboard
      • Dashboard
      • Account
      • Addresses
      • Membership Payments
      • Folio
      • Images
      • Submit News/Events
      • Shop Orders
      • My Membership
      • Downloads
      • Logout
    • Become a Member
  • Login
  • Become a Member
  • About
  • Campaigning
  • Resources


Lost your password?
You can also login or register here.
News
Next Article > < Previous Article

Varoom 41: Cutting Through

Visualising complicated information is a skill, but also a creative practice. In this excerpt from Varoom 41, Derek Brazell talks to Grundini and Delayed Gratification magazine to see how information graphics can help us understand the world around us.

Huge amounts of data on every aspect of our society and personal lives is being collected every second, and a vast volume of facts and figures is available to us. But for our busy minds it can be hard to follow, and so we can (and often do) choose not to take it all in. Nevertheless, we want to know how our intricate world works, to be illuminated by current affairs and historical facts and in an era of fake news, to understand what numbers and statistics really stand for. This is where someone else distilling information visually can step in.

Delayed Gratification, How to be Prime Minister, 2019

Data can be presented in a myriad of ways, and these concise images present only the essential information – “The tip of the iceberg is the image – the bit you see above water,” explains Peter Grundy (aka Grundini), but each one is the result of painstaking analysis of a subject.

Grundini, Hampton Court, 2004

Grundini has been creating infographics since the late 1970s and he reveals his approach in issue 41 alongside the art director and editors of Delayed Gratification, the ‘slow journalism’ magazine, who design infographics for short, snappy pieces and to support more complex, challenging longform articles.

Varoom: What are the important elements of an infographic, and how does research come in?

Grundini: The important part of any project is the idea. Most people see the picture, but the true essence is the idea.
Clients often supply the content reference. My knowing as little as possible about the topic is helpful as I then design from the standpoint of the audience. Being an expert means you assume people know more than they do. So I’m often simplifying vast amounts of information down to the level of what need to be explained to the audience.

Grundini, Energy cycle for British Gas: A report cover showing how gas arrives in customers homes.

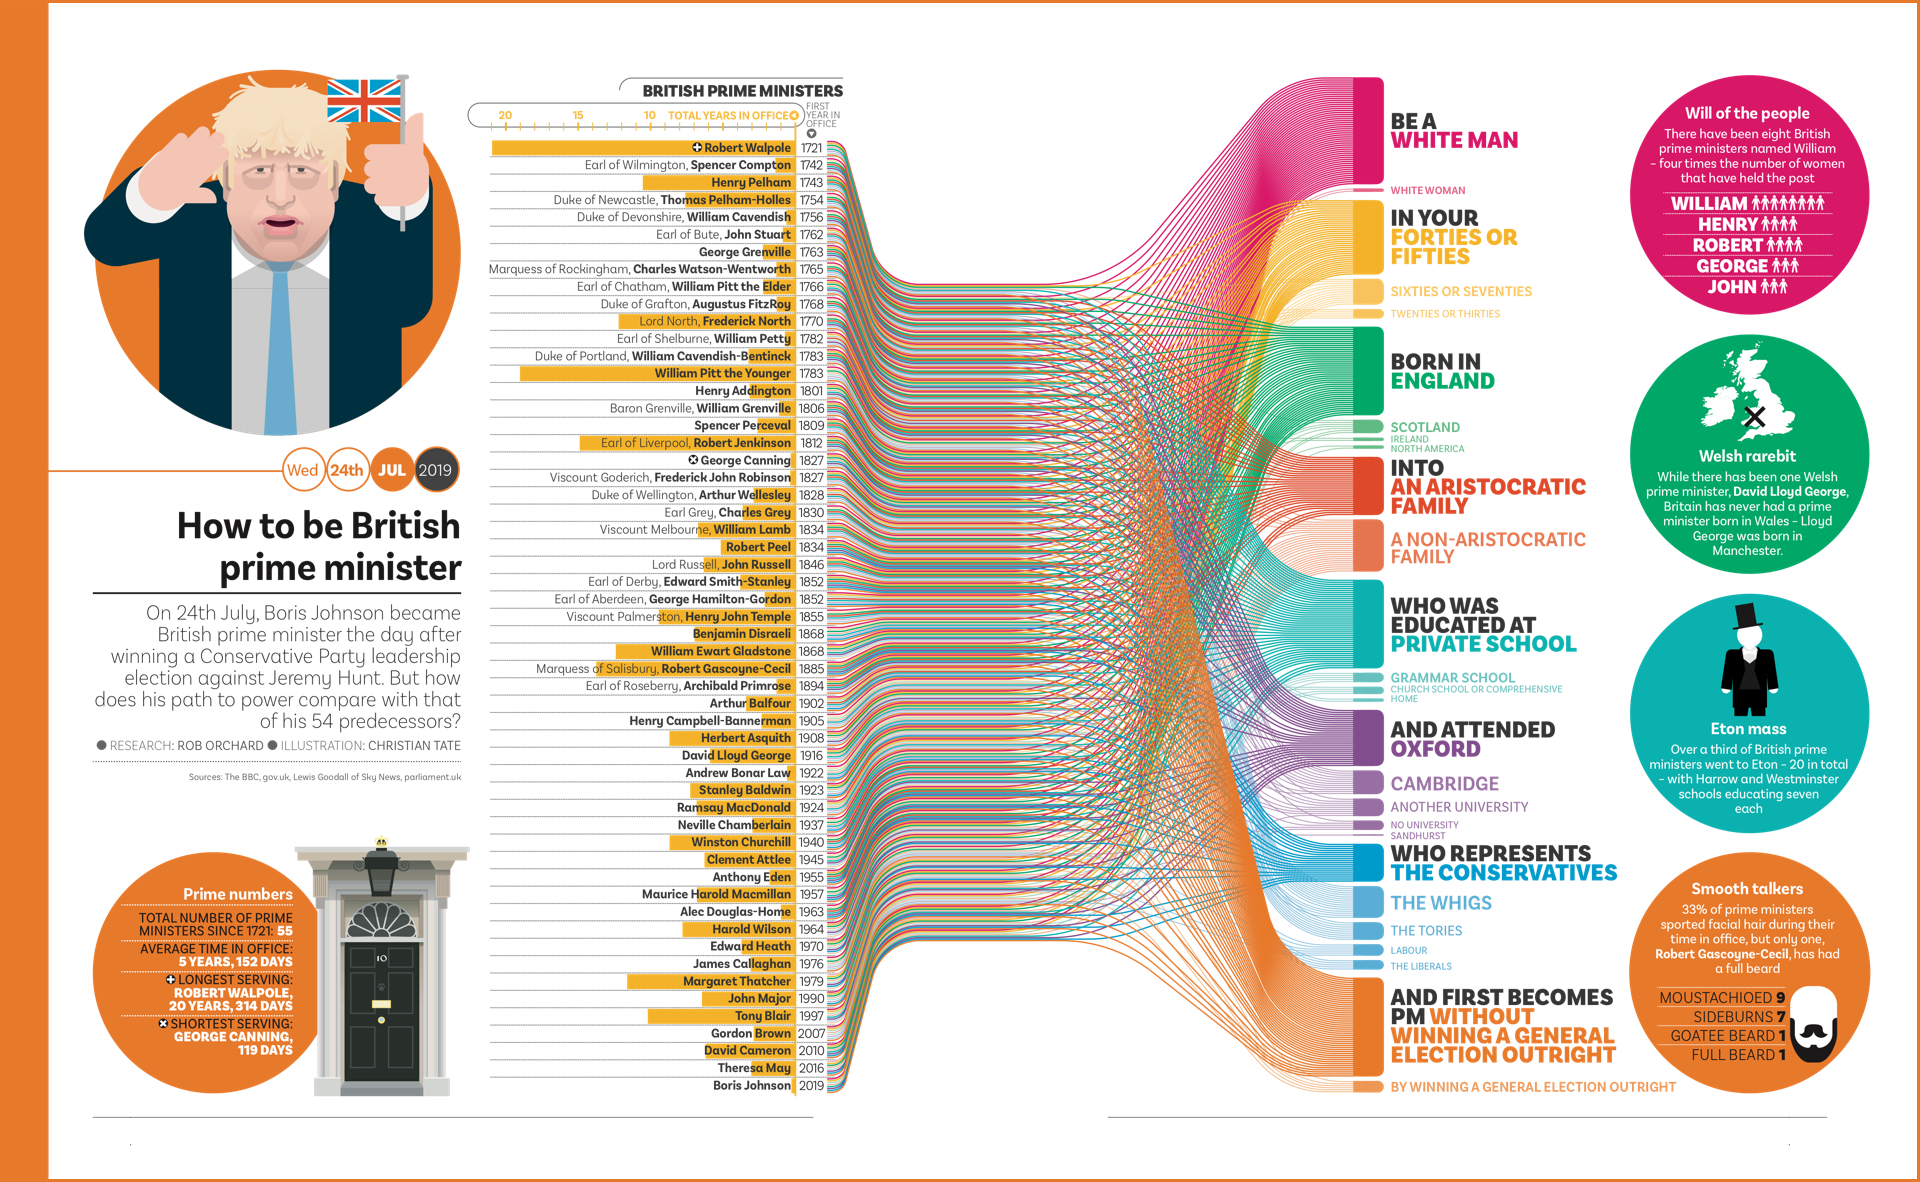
Christian Tate, Delayed Gratification Art Director

Varoom: How did you learn to construct effective infographics?

Christian Tate: To an extent I was drawn to infographics out of necessity. When we launched Delayed Gratification we felt it was important to find innovative ways to present news stories and in infographics I saw an opportunity to do something visual and creative while including lots of data. I learned to construct them more effectively through making mistakes. The key is to not overcomplicate things, to know what to leave out.

Delayed Gratification, Beatles infographic, issue 36, 2019
To read all of Cutting Through get Varoom 41

Back to News Page
Share      
News
Folios
Awards
  • Awards Home
  • About WIA
  • Longlist / Previous Winners
  • Touring Exhibition
  • News
Resources

All Resources

  • Inside Illustration
  • Illustration Pricing Survey
  • Consultations
  • Discounts
  • Helpdesk
  • AOI Meet Ups
  • Recordings
Campaigning
  • Campaigns
    • Pay The Creator
    • Diversity & Inclusion
    • Not a Hobby
    • The AOI’s Stance on AI
    • Fair Terms for Creators
    • Price it Right
    • Keep Your Copyright
  • Legislation
  • Partner Organisations
  • Fighting Fund

Shop
  • All Products
  • Consultations
  • Directories
  • Folio
  • Publications
  • Recordings
About
  • About the AOI
  • Our History
  • Our People
    • Staff
    • Meet Up Hosts
    • Board
    • Patrons
  • Contact Us
  • Jobs
  • FAQs
Connect with us
Sign up to our Newsletter
   

Website Terms
Cookie Policy
Shop Terms of Sale
Privacy Policy
Membership Terms


Somerset House, Strand, London WC2R 1LA, UK.
Please note that we are an administrative office and all visits are by appointment only

The Association of Illustrators is a company registered in England and Wales. Company registration 01237440. VAT GB393872701.
© Association of Illustrators. All rights reserved, site built with tlc