A chart maker who previously worked as senior designer at BuzzFeed News and as a writer/illustrator for BuzzFeed, Michelle Rial’s new book Am I Overthinking This? is subtitled Over-answering life’s questions in 101 charts. With the new Varoom themed on No Narrative, we talk to her about how her smart, witty charts are created and how her ‘real life charts’ evolved.
Varoom: You’ve clearly got an on-going interest in the relationship between things. Has this developed over time?
Michelle Rial: This has always been something on my mind. I love the concept of combinatorial creativity and this is what drew me to the creative side of advertising when I was in college, even though I started off studying math.
Will you go through several versions of a chart before deciding on what works best? And what are the differences in creating a chart for a commission and one that is self-generated?
Yes, I mostly just let it sit and evolve it until it’s something I think is good or smart or funny. Sometimes I’ll “finish” it and realize later it could’ve been better so I’ll add elements. I don’t ever really consider anything finished. There are some that have been updated 3-4 times, usually evolved with an additional object.
Although you also create very graphic images, what are the positives of a drawing based/hand rendered approach for your (personal and commissioned) charts?
Hand drawn keeps me off the computer, which is good because I have chronic repetitive strain issues, which is what led me into the analog + object style. But there are also issues with drawing by hand so I have a process that involves both so I can moderate how I’m using my body.
Also, what inspires you to use a range of materials – from pencils to ‘chewed watermelon’?
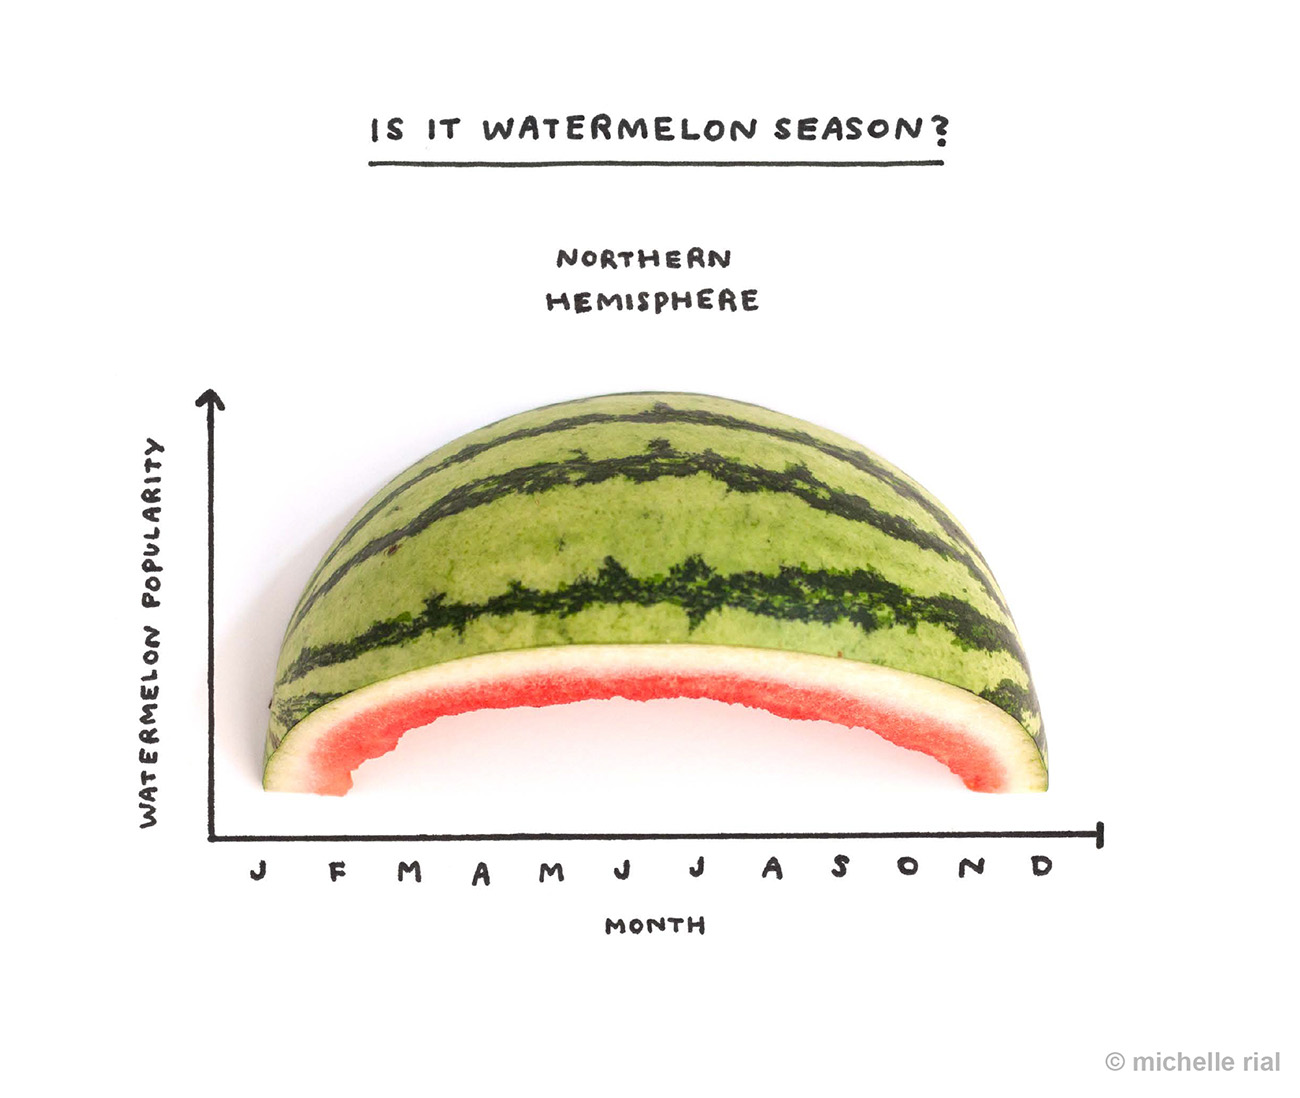
I made my first “real life chart” by setting my paper down to let ants crawl over it as to illustrate my hatred of ants (up and to the right as quantity of ants grows). One day I was playing with a watermelon rind after I ate it, first made it into a smiley face, then realized the arc coordinated with the popularity of watermelon in summer. And it can be flipped to work for either hemisphere.
Does this work cross pollinate with your other professional areas (writing, illustration)?
I really enjoy being hired to create conceptual illustrations that include some copy, and while they’re not all chart-based, they feel chart-adjacent. I recently stopped accepting jobs that are the illustration of an existing idea because there are so many other people better at that and I don’t see it as my strength.
Has social media response been an influence on what you produce?
I think so? I made charts for fun and then for media companies I worked at or pitched to. I think putting them on Instagram has made it so I don’t have to do a series of several to be able to put it out into the world (for a publication). I can just do a one off and be done with it. But, of course, no one is paying me to put them on Instagram! Before I was putting them on Instagram I was making novelty Twitter chart accounts, and while I was doing that, I was pitching them to online publications. I always had it in the back of my mind to make a book out of a series, and having my own audience helps get the word out to people who will enjoy it if they already enjoy what they see me post online.
Am I Overthinking This? Over-answering life’s questions in 101 charts is out now
Check out Michelle’s Instagram account for great chart ‘comment’ on the current world turmoil.
Purchase Varoom 41 here